


Table of contents
- Introduction: Charting Your Course
- Chapter 1: Helm - Your Trusty Navigator
- Chapter 2: Prometheus Chart - The North Star of Metrics
- Chapter 3: Connecting to Prometheus - Anchoring Your Insights
- Chapter 4: Prometheus Configuration
- Chapter 5: Deploying the Demo App
- Chapter 6: Service Monitors - Navigating Specifics
- Chapter 7: Adding Rules - Crafting Alerts Like a Pro
- Chapter 8: Alertmanager Rules - Keeping a Weather Eye Open
- Conclusion: Setting Sail for Prometheus Glory
Introduction: Charting Your Course
💡Welcome to a journey of seamless Kubernetes monitoring powered by Prometheus. Set Prometheus's watchful eye inside your cluster, capturing critical metrics for a profound understanding of your system's health. 📊
Deploying Prometheus within your Kubernetes cluster offers a powerful vantage point for monitoring your applications and infrastructure. By positioning Prometheus close to your targets, you ensure efficient data collection and real-time insights into performance and resource utilization. 🚀
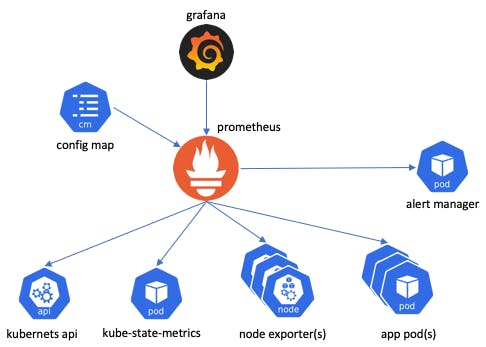
Monitoring Kubernetes Cluster includes:
Control Plane Components:
kube-state-metrics:
kubelet (cAdvisor):
Push Gateway:
Node Exporter:
Chapter 1: Helm - Your Trusty Navigator
🎩 Welcome to the Helm helm! In this section, we'll walk you through installing Helm, demystify what a chart is (hint: it's like a mix of value and manifest files), and then get hands-on with deploying Prometheus using Helm charts. Think of it as your GPS for smooth sailing in the world of deployments.
Installing Helm: Your Deployment Companion
🌐 Getting Helm Onboard: Let's start by getting Helm installed. It's like adding a trusty sidekick to your deployment adventures. Just paste these commands, and you're good to go:
  curl -fsSL -o get_helm.sh https://raw.githubusercontent.com/helm/helm/master/scripts/get-helm-3
  chmod 700 get_helm.sh
  ./get_helm.sh
With Helm by your side, you're all set to navigate the seas of deployment.
Understanding Charts: The Magic Blueprints
💡 What's a Chart, Anyway?:
Think of charts as the magical blueprints for your deployment. They bring together value files (for custom settings) and manifest files (to describe your application's needs) in a neat package.
Adding Prometheus Chart Repository: Your Beacon
🗺️ Chart Repositories: Picture chart repositories as your guiding beacons to find what you need. For Prometheus, we'll tap into its official repository. Just a couple of commands, and you're connected:
  helm repo add prometheus-community https://prometheus-community.github.io/helm-charts
  helm repo update
Now, let's set our course towards deploying Prometheus.
Prometheus Deployment: Let's Get Started
⚓ Setting Sail with Prometheus: This is where Helm's magic shines. Deploying Prometheus becomes a breeze with Helm. Ready? Just type this command and watch the magic happen:
  helm install [RELEASE_NAME] prometheus-community/kube-prometheus-stack
  # [RELEASE_NAME] -- Can be anything of your choice. Use 'prometheus'
By default, this chart installs additional, dependent charts:
Like a captain summoning the crew, Helm takes care of the rest and brings Prometheus to life.
🔚 For uninstalling a helm chart :
helm uninstall [RELEASE_NAME]
Fine-Tuning the Journey: Customization Made Easy
🛠️ Fine-Tuning with Value Files: Helm's your customization wizard. To tweak Prometheus' journey, use value files to adjust settings to your liking:
  # check values.yaml for all the settings to customize and install
  helm show values prometheus-community/kube-prometheus-stack > values.yaml
  helm install prometheus prometheus-community/kube-prometheus-stack -f values.yaml
Much like tailoring a suit, you're shaping Prometheus' course to fit perfectly into your Kubernetes world.
Helm Upgrade: Elevate and Adapt
📈 Chart Evolution with Helm: Helm's prowess extends beyond the initial deployment. It's your compass for upgrades. When a newer version of Prometheus beckons, Helm enables seamless upgrades:
helm upgrade prometheus prometheus-community/kube-prometheus-stack
Chapter 2: Prometheus Chart - The North Star of Metrics
🔍In this segment, we'll take a deep dive into the components that compose this remarkable chart.
kubectl get all
StatefulSets: The Backbone of Persistent Services
🏰 StatefulSets orchestrate the deployment of stateful applications. In the context of the chart, they bring forth the powerful Prometheus servers and Alertmanager instances. These StatefulSets ensure that Prometheus' vital data is persistently stored and managed, guaranteeing resilience and accuracy in your monitoring.Deployments: Scaling with Grace
🚀 Scaling Through Deployments: Deployments handle the rollout and scaling of stateless applications. Within the chart, they manage components like the Grafana, Prometheus Operator and kube-state-metrics. Join us as we delve into the unique role, significance, and collective impact of these components on your Kubernetes monitoring ecosystem.DaemonSets: Agents on Every Node
🚤 Exploring DaemonSets: DaemonSets ensure that a specific pod runs on every node in your cluster. The chart's DaemonSets, exemplified by the Node Exporter, provide critical node-level metrics. These agents ensure comprehensive monitoring coverage by collecting data from every node, enhancing your understanding of cluster health.Pods: Collaboration in Containers
📦 Pods in Harmony: Pods encapsulate one or more containers, sharing the same network space. Within the chart, pods house vital components like Prometheus, Grafana, and more. These pods collaborate to create a cohesive monitoring environment, allowing different components to work together seamlessly.Services: Networking and Connectivity
🌐 Navigating Services: Services expose pods to the network, enabling communication within and beyond the cluster. In the chart, services connect components like Prometheus and Grafana to facilitate interactions. They play a pivotal role in ensuring seamless data flow and access across your monitoring ecosystem.ReplicaSets: Ensuring Availability and Resilience
🔁 ReplicaSets in Action: ReplicaSets guarantee that a specified number of replicas are available at all times. While not directly managed in the chart, they contribute to the reliability of your monitoring components. ReplicaSets ensure that your Prometheus, Alertmanager, and other components maintain the desired level of availability.
Seamless Rule Configuration: Accessing Rule Configurations from Prometheus StatefulSet
Step 1: Identifying Your StatefulSet Prometheus Instance
🔍 Begin by identifying the StatefulSet-managed Prometheus instance you want to customize. You can list your running StatefulSets using:kubectl get statefulsets -n <namespace>Locate the Prometheus StatefulSet you want to customize.
Step 2: Accessing the Configuration Map
📂 Let's access the configuration map that holds your rule files. Use the following command to describe the StatefulSet and find the name of the configuration map:
kubectl describe statefulset <prometheus-statefulset-name> -n <namespace> > prometheus-instance.yamlLook for the "ConfigMap" section. This is where you'll find the name of the configuration map that holds your rule files.
Step 3: Describing the Configuration Map
📋 Now, let's get a closer look at the configuration map. Run the following command:kubectl describe configmap <configmap-name> -n <namespace>This will provide detailed information about the configuration map, including the rule files it contains.
Step 4: Operator's Toolkit in the Deployment Set
🔧 As we journey through the Deployment set, remember the Operator's toolkit. Within this set, the Prometheus Operator orchestrates the deployment, management, and configuration of Prometheus instances. It's here that the magic happens—grabbing the configuration map for rule files directly from the Prometheus instance managed by the Operator.
kubectl describe deployment <prometheus-operator> -n <namespace>
Chapter 3: Connecting to Prometheus - Anchoring Your Insights
In this section, we'll dive into the various methods to connect to your Prometheus instance and interact with the metrics it collects. Prometheus offers powerful insights, but how you access it greatly influences your monitoring experience.
Step 1: Initial Access using ClusterIP
By default, Prometheus often uses a ClusterIP service type, limiting access to within the cluster. To connect to Prometheus using this setup, you can use the internal ClusterIP address. Keep in mind that this access is limited to within the cluster environment.
Step 2: Upgrading to NodePort or LoadBalancer
For external access to Prometheus, consider transitioning to NodePort or LoadBalancer service types. Here's how you can upgrade to NodePort:
  kubectl edit svc <prometheus-service-name> -n <namespace>
  # Change type: ClusterIP to type: NodePort
For LoadBalancer:
  kubectl edit svc <prometheus-service-name> -n <namespace>
  # Change type: ClusterIP to type: LoadBalancer
Step 3: Using Port-Forward for Temporary Access
For quick and temporary access during development, use the
kubectl port-forwardcommand:kubectl port-forward <prometheus-pod-name> 9090:9090 -n <namespace>Access Prometheus at
http://localhost:9090in your browser.Step 4: Accessing Prometheus via Localhost:9090
After port-forwarding, open your browser and navigate to
http://localhost:9090. You'll land on the Prometheus web interface, ready to execute queries, explore metrics, and glean insights from your monitored resources.
Chapter 4: Prometheus Configuration
In this section, we'll guide you through configuring Prometheus to harness the power of Kubernetes service discovery. By automatically discovering and monitoring Kubernetes resources, you'll lay the foundation for effective monitoring.
Step 1: Embracing Kubernetes Service Discovery Configurations
Prometheus offers tailored configurations for Kubernetes service discovery. These configurations enable Prometheus to dynamically detect and monitor your Kubernetes pods and services, adapting seamlessly to changes in your environment.Step 2: Exploring Prometheus Web UI: Status > Configuration
Open your browser and access the Prometheus web interface.
Click on the "Status" tab, followed by "Configuration."
Step 3: Unveiling Kubernetes Service Discovery Details
In the "kubernetes-sd-configs" section, explore the breakdown of your Kubernetes service discovery configurations.
Look for the category labelled "role: endpoints". This is where you uncover the "endpoints" category, revealing the endpoints associated with your Kubernetes service discovery.
Step 4: Checking Targets in the Service Discovery Tab
Navigate to the "Service Discovery" tab within the Prometheus web UI.
Here, you'll find a list of targets that Prometheus has successfully discovered and connected to.
The "UP" status beside each target indicates its accessibility and readiness for monitoring.
Chapter 5: Deploying the Demo App
In this section, we'll guide you through deploying a simple Flask demo application onto your Kubernetes cluster.
Step 1: Develop a Dummy Flask App
Create a directory named "demo-flask-app" and within it, create a file named
app.pywith the following content:from flask import Flask app = Flask(__name__) @app.route('/') def hello(): return "Hello, Kubernetes Flask App!" if __name__ == '__main__': app.run(host='0.0.0.0')Step 2: Crafting a Dockerfile
In the "demo-flask-app" directory, create a file named "Dockerfile" with the following content:
  FROM python:3.9
  WORKDIR /app
  COPY requirements.txt .
  RUN pip install -r requirements.txt

  COPY . .
  CMD ["python", "app.py"]
Create a file named "requirements.txt" with the following content:
Flask==2.0.1Step 3: Building the Docker Image
Navigate to the "demo-flask-app" directory and run the following command to build the Docker image:
docker build -t demo-flask-app:v1 .Step 4: Creating Kubernetes Deployment and Service Manifests
Now, let's deploy the simple flask application with 3 replicas which listen and expose metrics on port8080.Create a file named "demo-flask-app-deployment.yaml" with the following content:
  apiVersion: apps/v1
  kind: Deployment
  metadata:
    name: example-app
  spec:
    replicas: 3
    selector:
      matchLabels:
        app: example-app
    template:
      metadata:
        labels:
          app: example-app
      spec:
        containers:
        - name: example-app
          image: demo-flask-app:v1
          ports:
          - name: web
            containerPort: 8080

  ---
  apiVersion: v1
  kind: Service
  apiVersion: v1
  metadata:
    name: example-app
    labels:
      app: example-app
  spec:
    selector:
      app: example-app
    ports:
    - name: web
      port: 8080
Let's expose the application with a Service object which selects all the Pods with the
applabel having theexample-appvalue. The Service object also specifies the port on which the metrics are exposed.Step 5: Deploying the Demo Flask App
Apply the deployment and service manifests using the following commands:kubectl apply -f demo-flask-app-deployment.yamlStep 6: Accessing the Demo Flask App
Retrieve the assigned NodePort using the following command:
kubectl get svc demo-flask-app-serviceIn your browser, navigate to
http://<Node-IP>:<NodePort>to access the demo Flask app.
Chapter 6: Service Monitors - Navigating Specifics
In this section, we'll delve into the world of Prometheus Custom Resource Definitions (CRDs), specifically focusing on Service Monitors. As part of the Prometheus Operator's toolkit, Service Monitors play a pivotal role in automating the discovery of targets for Prometheus.

Understanding CRDs: Custom Resource Definitions
Custom Resource Definitions (CRDs) extend Kubernetes to incorporate your own resource types. They enable you to define and manage resources beyond the built-in ones like pods and services. Prometheus Operator leverages CRDs to bring Kubernetes-native declarative configuration to Prometheus deployments.
Exploring Service Monitors: Automating Target Discovery
Service Monitors are a prime example of Prometheus Operator's CRDs. They define how Prometheus should monitor a specific service. By specifying labels that match your target services, Service Monitors automate the discovery of endpoints to be monitored. This dynamic setup adapts as your services scale or change.Connecting Service Monitors to Demo Flask App
Imagine our "demo-flask-app" as a service you wish to monitor. Let's create a Service Monitor "demo-flask-app-servicemonitor.yaml" to automate its discovery for Prometheus:apiVersion: monitoring.coreos.com/v1 kind: ServiceMonitor metadata: name: example-app labels: team: frontend spec: selector: matchLabels: app: example-app endpoints: - port: webHere, we create a ServiceMonitor object which selects all Service objects with the
app: example-applabel. The ServiceMonitor object also has ateamlabel (in this caseteam: frontend) to identify which team is responsible for monitoring the application/service.Apply the Service Monitor to your Kubernetes cluster
Run the following command to deploy the Service Monitor:kubectl apply -f demo-flask-app-servicemonitor.yamlThis will create the Service Monitor object in your cluster, and Prometheus Operator will pick it up and configure Prometheus to scrape the specified targets according to the configuration.
Remember to adjust the labels and other configurations to match your specific application and monitoring requirements.
Let's now proceed to the Prometheus web UI and verify the status of our monitoring targets. This step is crucial to ensure that we are indeed receiving metrics from our application.
Chapter 7: Adding Rules - Crafting Alerts Like a Pro
In this section, we'll dive into the concept of adding custom rules to your Prometheus monitoring setup using the PrometheusRule Custom Resource Definition (CRD). By defining these rules, you can fine-tune alerting thresholds and other behaviours to match your specific application and infrastructure needs.
Introducing PrometheusRule CRD: Crafting Custom Monitoring Rules
The
PrometheusRuleCRD provides a powerful way to extend and customize your monitoring capabilities within the Prometheus ecosystem. With this CRD, you can define alerting and recording rules that suit your application's unique characteristics. These rules govern when alerts should be triggered and what metrics should be recorded, giving you greater control over your monitoring precision.Example: Custom Alerting Rule
Let's consider an example "custom-alert-rules.yaml" where you want to set up a custom alerting rule for high CPU usage in a particular application. Here's how you can create aPrometheusRulefor this purpose:apiVersion: monitoring.coreos.com/v1 kind: PrometheusRule metadata: name: custom-alert-rules labels: release: prometheus spec: groups: - name: high-cpu-alerts rules: - alert: HighCPULoad expr: node_cpu_seconds_total / node_memory_MemTotal * 100 > 80 for: 5m labels: severity: critical annotations: summary: High CPU Usage Detected description: High CPU usage detected on {{ $labels.instance }}Apply the PrometheusRule to your cluster
Run the following command to apply the rule to your Kubernetes cluster:kubectl apply -f custom--alert-rules.yamlVerify the rule's status
You can check the status of the applied rule using the following command:
kubectl describe prometheusrule custom-alert-rulesThis command will provide detailed information about the
PrometheusRule, including its groups, rules, and other configuration details.
Chapter 8: Alertmanager Rules - Keeping a Weather Eye Open
In this section, we'll delve into the realm of Alertmanager rules, which play a pivotal role in defining how alerts are managed, grouped, and dispatched. By harnessing Alertmanager rules, you gain the power to shape your alert notifications in ways that align with your operational priorities.
Decoding Alertmanager Rules
Alertmanager rules are your toolkit for sculpting the behaviour of alerts, enabling you to control their routing, deduplication, grouping, and notification channels. With these rules, you shape how alerts are handled, ensuring that critical incidents receive the attention they deserve while minimizing alert fatigue.Scenario: Differentiating Critical and Minor Alerts
Consider a scenario where you want to differentiate between critical and minor alerts. Here's how you can achieve this using Alertmanager rules.Save the following content as
alertmanager-custom-rules.yaml:apiVersion: monitoring.coreos.com/v1 kind: AlertmanagerConfig metadata: name: alertmanager-custom-rules labels: release: prometheus spec: route: routes: - match: name: severity value: critical receiver: critical-email - match: name: severity value: minor receiver: minor-email - match: name: severity value: minor receiver: slack-notification receivers: - name: critical-email email_configs: - to: critical@example.com send_resolved: true - name: minor-email email_configs: - to: minor@example.com send_resolved: true - name: slack-notification slack_configs: - api_url: https://hooks.slack.com/services/your/slack/webhook/url channel: "#alerts" text: "Alert: {{ .CommonAnnotations.summary }}"For
critical-emailandminor-emailreceivers, email_configs are defined to send alerts to the specified email addresses. Thesend_resolvedfield is set to true to also send "resolved" alerts.For the
slack-notificationreceiver, slack_configs are defined to send alerts to a Slack channel. You'll need to replaceapi_urlwith your actual Slack webhook URL.
Updating the alertmanagerConfigSelector
Locate Helm Values for the Prometheus Chart
helm show values prometheus-community/kube-prometheus-stack > values.yamlThis command fetches the default values for the
prometheus-community/kube-prometheus-stack chartand saves them to a file namedprometheus-values.yaml.Edit Helm Values
 alertmanagerConfigSelector:
   matchLabels:
     release: prometheus
This configuration tells Prometheus to use your custom Alertmanager configuration associated with the
prometheusrelease.Upgrade the chart
helm upgrade prometheus prometheus-community/kube-prometheus-stack -f values.yamlThis command upgrades the
prometheusrelease with the modified values, ensuring that it now references your custom Alertmanager configuration.
💡Why We're Doing This:
By updating the
alertmanagerConfigSelectorin the Helm values, you're instructing Prometheus to associate your custom Alertmanager configuration with the Prometheus deployment. This ensures that the alerting rules and notification configurations you've defined will be correctly integrated and utilized by the Prometheus Operator.This integration is essential for maintaining consistency between your monitoring components and making sure that your custom configurations take effect as expected.
Conclusion: Setting Sail for Prometheus Glory
⛵ Setting Sail for Prometheus Glory: Bravo, fellow mariner of metrics! You've conquered Prometheus like a true captain. With these newfound skills, you're poised to navigate Kubernetes waters with confidence and humour. Remember, the journey doesn't end here. Keep exploring, keep monitoring, and may your data always flow as smoothly as a calm sea.

See you on the next one. Cheers! ✨🚀