


So, here's the deal: Recently, I stumbled upon this tool called Prometheus, which is all about monitoring stuff. At first, I thought, "Hey, that's more of a DevOps thing, right?". But curiosity got the best of me, and I realized that knowing how our applications are holding up is becoming pretty darn important for us developers too. So, I decided to dive into Prometheus, starting with how to get it onto my Mac. So, I explored Prometheus, starting with the Mac setup. I'll share how I dipped my toes, pulled metrics from Mac, set alerts for issues, and covered email alerts. Join me to tackle Prometheus; it's more relevant than we think! 🧐
Setup Node Exporter 📊
Imagine your local server – laptop, desktop, whatever. You want the scoop on what's going down inside. Enter Node Exporter: It's your server's storyteller. Install it, and suddenly it's whispering secrets to Prometheus (the big monitoring boss) about your server's inner workings. And guess what? You can see all this data visualized on Prometheus' dashboard. Cool, right? 😉
Follow the steps 👩🏻💻
From Prometheus' official documentation, find the latest release for Node Exporter and copy the link for
darwinedition. Use the below cURL command to install the archive.curl -O 'https://github.com/prometheus/node_exporter/releases/download/v1.6.1/node_exporter-1.6.1.darwin-amd64.tar.gz' -LUnarchive the file with the below command.
gunzip -c node_exporter-1.4.0.darwin-amd64.tar.gz| tar xopf -Navigate into the folder and fire up the node exporter server using the command below. Keep in mind that it usually cruises on port 9100, but here's the kicker: We're spinning up three separate instances on ports 9100, 9101, and 9102 for the next steps.
  ./node_exporter --web.listen-address 127.0.0.1:9100
  ./node_exporter --web.listen-address 127.0.0.1:9101
  ./node_exporter --web.listen-address 127.0.0.1:9102
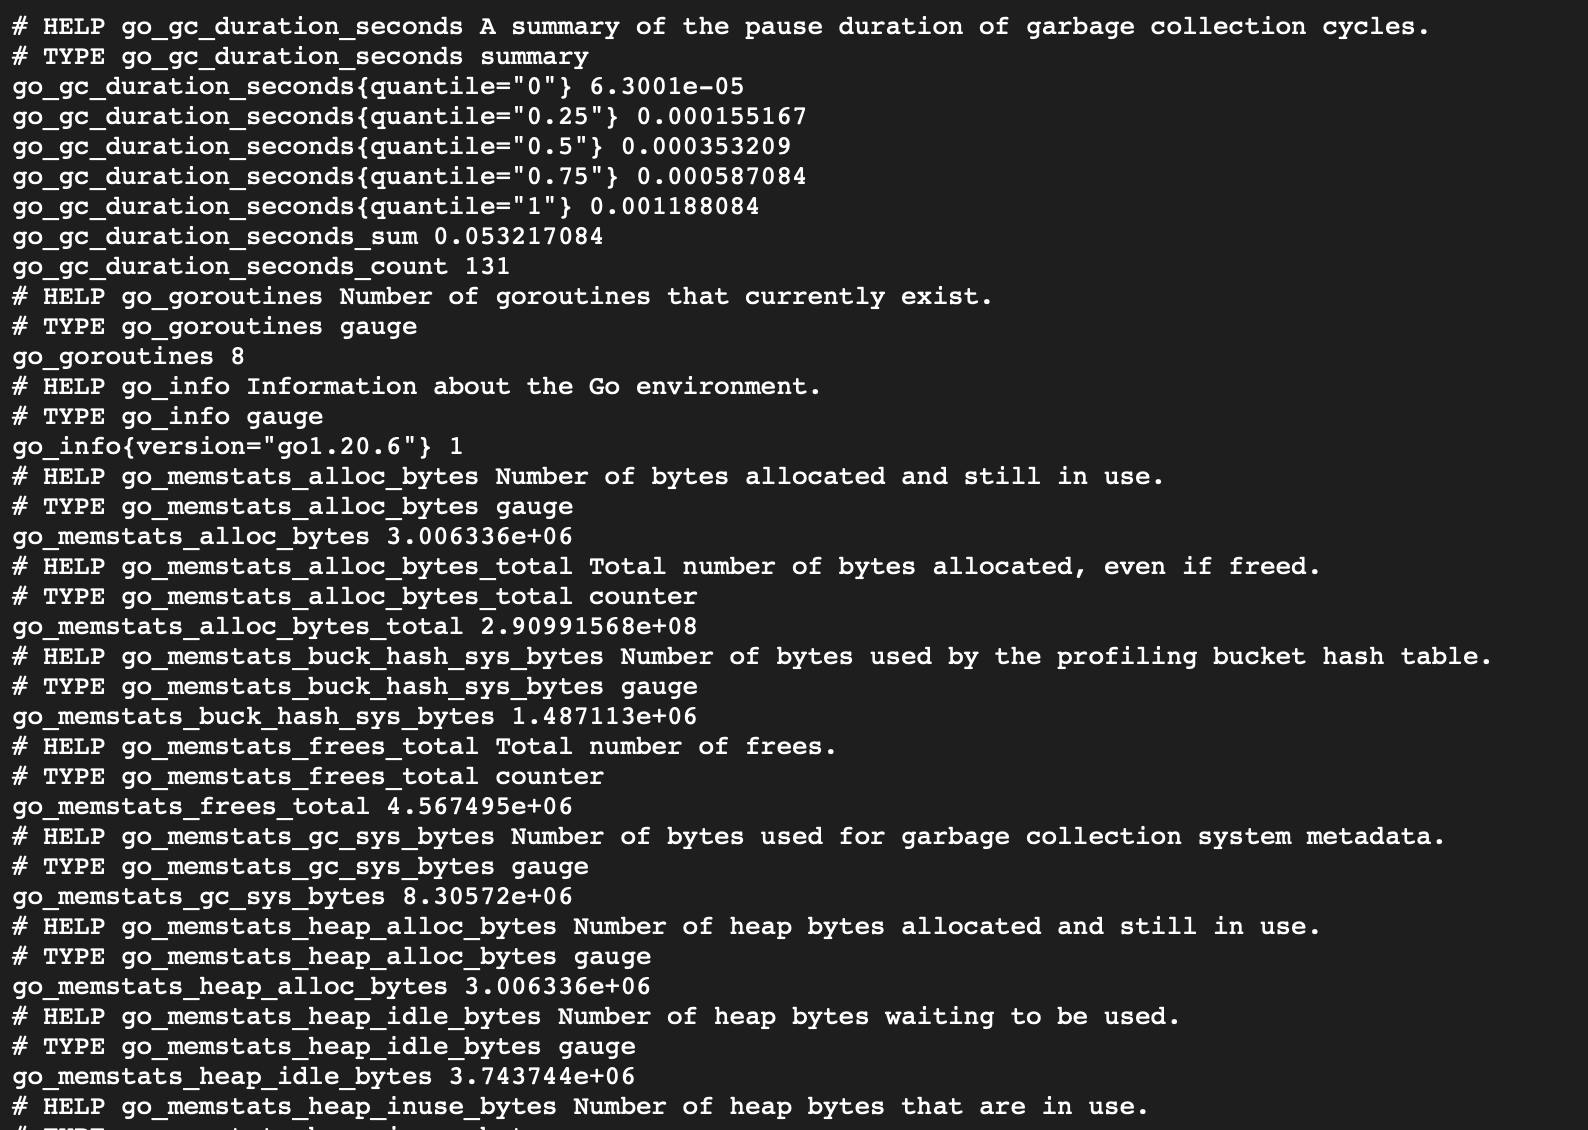
Now that you've got your node exporter instances up and running, you should be good to go and access the link localhost:9100/metrics.
Setup Prometheus 📈
Alright! Now think of Prometheus as your server's smart watchdog. Install it, and it's like Sherlock Holmes for your system's health. It snags data from all your apps and gadgets – CPU, memory, network jazz, you get the drift. It transforms the raw data into cool charts, readable even by non-techies. When something's awry, it waves a red flag – "Hey, things are off!" Plus, you can ask Prometheus to watch for certain issues and ping you via email if things go wild. It's like your server's guardian angel, while you chill with your coffee. ☕️
Follow the steps 👩🏻💻
Similar to Node Exporter, you again copy the
darwinversion of Prometheus from official documentation and unarchive the file.curl -O 'https://github.com/prometheus/prometheus/releases/download/v2.46.0/prometheus-2.46.0.darwin-amd64.tar.gz' -L gunzip -c prometheus-2.46.0.darwin-amd64.tar.gz| tar xopf -Head into the unzipped directory. It's time to set up "prometheus.yml" to recognize three node exporter instances working on designated ports. While default settings exist, customization is needed. We'll enhance the
scrape_configswith our instance's job name and refine the targets by specifying URLs and ports (you can also label them for "production" or "development" optionally).# A scrape configuration containing exactly one endpoint to scrape: # Here it's Prometheus itself. scrape_configs: # The job name is added as a label `job=<job_name>` to any timeseries scraped from this config. - job_name: "node_exporter" # metrics_path defaults to '/metrics' # scheme defaults to 'http'. static_configs: - targets: ["localhost:9100", "localhost:9101"] labels: group: "production" - targets: ["localhost:9102"] labels: group: "development"Additionally, you can also update the
scrape_interval(How frequently to scrape targets by default) andevaluation_interval(How long until a scrape request times out.) to 5s.# my global config global: scrape_interval: 5s # Set the scrape interval to every 15 seconds. Default is every 1 minute. evaluation_interval: 5s # Evaluate rules every 15 seconds. The default is every 1 minute. # scrape_timeout is set to the global default (10s).
Here's how our trusty "prometheus.yml" file shapes up:
# my global config
global:
scrape_interval: 5s # Set the scrape interval to every 5 seconds. Default is every 1 minute.
evaluation_interval: 5s # Evaluate rules every 5 seconds. The default is every 1 minute.
# scrape_timeout is set to the global default (10s).
# Alertmanager configuration
alerting:
alertmanagers:
- static_configs:
- targets:
# - alertmanager:9093
# Load rules once and periodically evaluate them according to the global 'evaluation_interval'.
rule_files:
# - "first_rules.yml"
# - "second_rules.yml"
  # A scrape configuration containing exactly one endpoint to scrape:
  # Here it's Prometheus itself.
  scrape_configs:
    # The job name is added as a label `job=<job_name>` to any timeseries scraped from this config.
    - job_name: "node_exporter"

      # metrics_path defaults to '/metrics'
      # scheme defaults to 'http'.

      static_configs:
        - targets: ["localhost:9100", "localhost:9101"]
          labels:
            group: "production"
        - targets: ["localhost:9102"]
          labels:
            group: "development"
With the configuration sorted, save the file and kickstart Prometheus by running the command
./prometheus. Now, hop onto localhost:9090/graph – your gateway to Prometheus' expression browser is all set! 🥳
Exploring Prometheus [Optional] 🧭
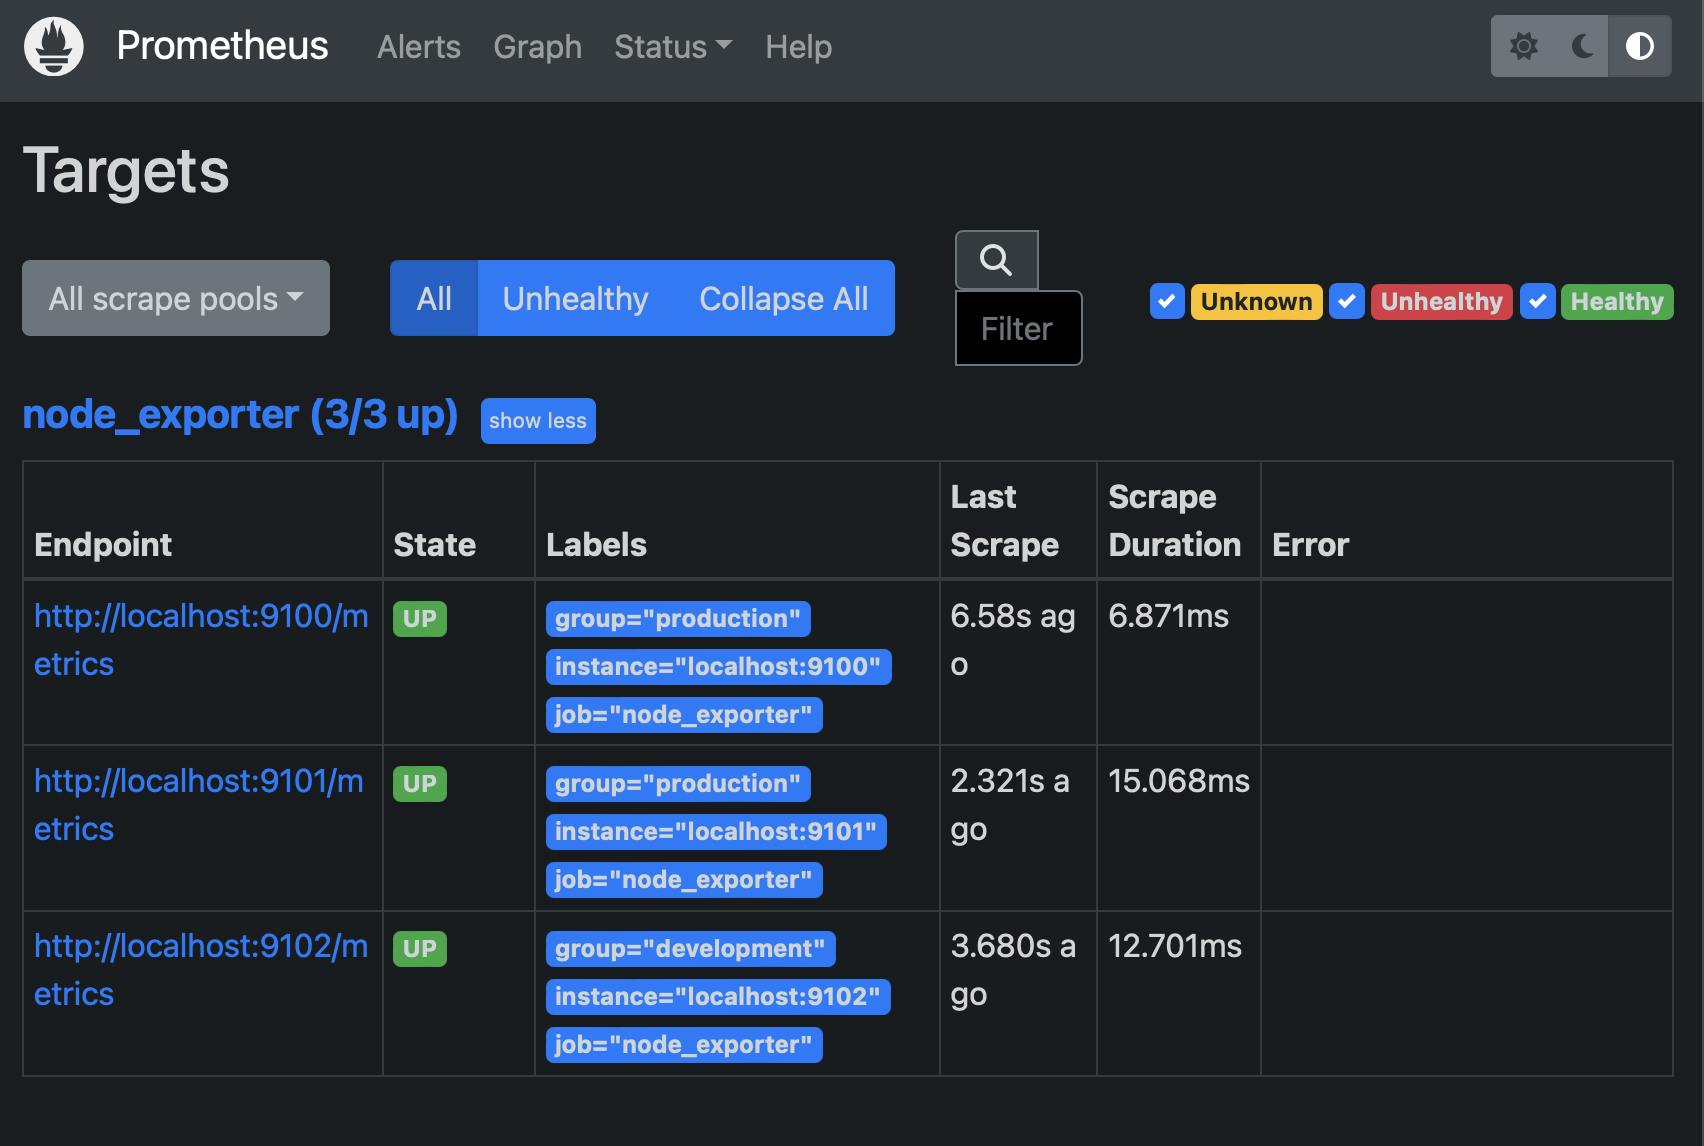
Within the expression browser, under Status > Targets (accessible at localhost:9090/targets), a comprehensive list of presently active instances will be displayed.
Additionally, by navigating to the Graph tab, you can execute queries on metrics and visualize time series graphs directly within the browser.
Query example 🖊️
Computing the per-second rate of change for the "node_cpu_seconds_total" metric over a 5-minute time window.
rate(node_cpu_seconds_total[5m])

You can explore more queries here.
Recording Rules 📝
Prometheus' recording rules are like metric hacks. When your metrics need some math or fancy tweaks for the insights you crave, these rules pre-calculate the magic and save it as new metrics. So, no more on-the-fly number crunching with every query. Think of them as your time-saving helpers—set a rule, and presto, you've got a fresh metric in your toolkit!
Follow the steps 👩🏻💻
Craft a fresh YAML file within the unzipped Prometheus folder—let's call it something like "prometheus.rules.yml".
In this step, we're introducing a fresh metric named
job_instance_mode:node_cpu_seconds:avg_rate5m. This metric performs an average calculation by instance, computing the rate ofnode_cpu_seconds_totalover a 5-minute window. Every time we run this, the magic happens!groups: - name: cpu-node rules: - record: job_instance_mode:node_cpu_seconds:avg_rate5m expr: avg by (instance) (rate(node_cpu_seconds_total[5m]))Next up, we need to give a heads-up to our "prometheus.yml" file about our brand-new recording rule file, "prometheus.rules.yml". Here's what your updated "prometheus.yml" looks like, with the file snuggled right under "rule_files":
  # my global config
  global:
    scrape_interval: 5s # Set the scrape interval to every 5 seconds. Default is every 1 minute.
    evaluation_interval: 5s # Evaluate rules every 5 seconds. The default is every 1 minute.
    # scrape_timeout is set to the global default (10s).

  # Alertmanager configuration
  alerting:
    alertmanagers:
      - static_configs:
          - targets:
            # - alertmanager:9093

  # Load rules once and periodically evaluate them according to the global 'evaluation_interval'.
  rule_files:
      - "prometheus.rules.yml"

  # A scrape configuration containing exactly one endpoint to scrape:
  # Here it's Prometheus itself.
  scrape_configs:
    # The job name is added as a label `job=<job_name>` to any timeseries scraped from this config.
    - job_name: "node_exporter"

      # metrics_path defaults to '/metrics'
      # scheme defaults to 'http'.

      static_configs:
        - targets: ["localhost:9100", "localhost:9101"]
          labels:
            group: "production"
        - targets: ["localhost:9102"]
          labels:
            group: "development"
Give the Prometheus server a restart. Now, check out the Expression field – you should spot a brand-new metric waiting for you, just like this:

Easy isn't it? 🥳
Alerting Rules 🚨
Alerting rules in Prometheus are like your personal watchdogs. They keep an eagle eye on your metrics and shout when things go haywire. You set up these rules to watch for specific conditions—like CPU going nuts or errors hitting a threshold. When the rules catch something fishy, they trigger alerts that can be sent as emails or notifications. It's like having a vigilant buddy to tap you on the shoulder when your system needs some TLC.
Follow the steps 👩🏻💻
You're about to set up an alert for a scenario where one or more of your node exporter buddies call it quits. The plan? Fire off alerts – these little signals will be caught by the Alertmanager, which can then shoot emails your way whenever any of your instances decide to take a break.
Craft a fresh YAML file called "alerting.rules.yml" right inside the unzipped Prometheus folder. Here's the code you need to put in there:
  groups:
    - name: server_is_down
      rules:
        - alert: server_is_down
          expr: up == 0
          for: 0m
          labels:
            severity: page
          annotations:
            summary: Server(s) are down.
up == 0gives us the instances that are currently down, whileup == 1fetches the instances that are up and running.Next up, we again need to give a heads-up to our "prometheus.yml" file about our brand-new alerting rule file, "alerting.rules.yml". Here's what our updated "prometheus.yml" looks like, with our file snuggled right under
rule_files:# my global config global: scrape_interval: 5s # Set the scrape interval to every 5 seconds. Default is every 1 minute. evaluation_interval: 5s # Evaluate rules every 5 seconds. The default is every 1 minute. # scrape_timeout is set to the global default (10s). # Alertmanager configuration alerting: alertmanagers: - static_configs: - targets: # - alertmanager:9093 # Load rules once and periodically evaluate them according to the global 'evaluation_interval'. rule_files: - "prometheus.rules.yml" - "alerting.rules.yml" # A scrape configuration containing exactly one endpoint to scrape: # Here it's Prometheus itself. scrape_configs: # The job name is added as a label `job=<job_name>` to any timeseries scraped from this config. - job_name: "node_exporter" # metrics_path defaults to '/metrics' # scheme defaults to 'http'. static_configs: - targets: ["localhost:9100", "localhost:9101"] labels: group: "production" - targets: ["localhost:9102"] labels: group: "development"Restart the Prometheus server.
You should now be able to see our alert under http://localhost:9090/alerts.
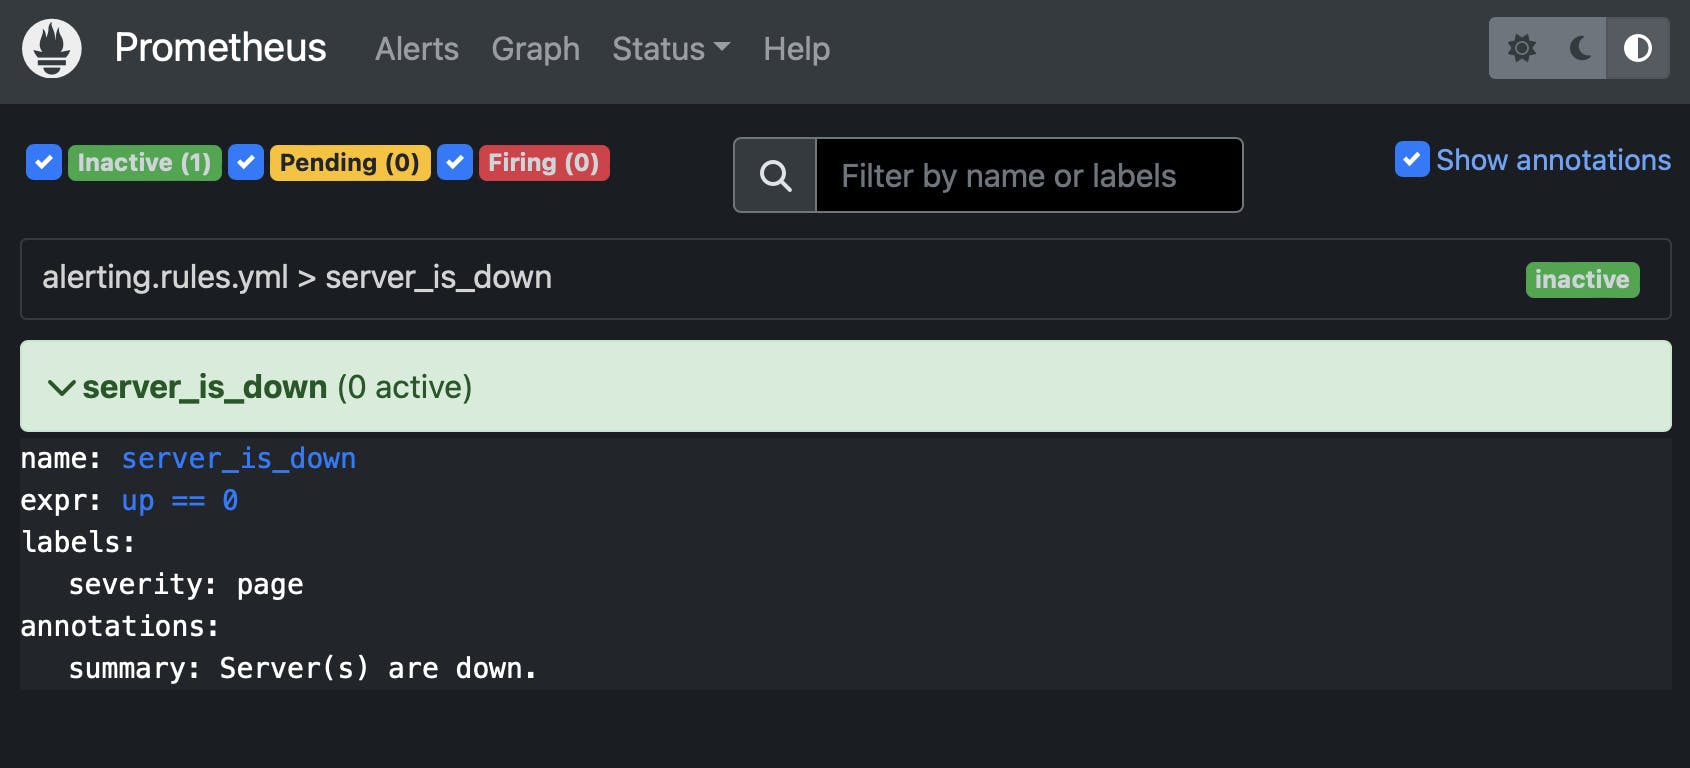
Now, let's put one of the instances to rest (e.g. the one hanging out on port 9101). If we take a peek in your browser, we'll catch a glimpse of the screen below. That's our cue that an alert has been triggered.

Hooray! You've nailed it – our Prometheus is all set to unleash alerts for those specific expressions. Now, for the grand finale and the moment you've been waiting for: let's trigger notifications as soon as those alerts go off! 🎊
Setup Alertmanager 💡
So, let's talk Alertmanager – it's like the maestro of our notification orchestra. When Prometheus waves the alert flag, Alertmanager steps in with a smooth move: it sends out notifications, like emails, on-call notification systems, and chat platforms.
We're about to dive into setting up Alertmanager to send out email notifications. Let's get started!
Follow the steps 👩🏻💻
Once more, let's snag that darwin version of Alertmanager straight from the official documentation. After that, unarchive the file just like before.
  curl -O 'https://github.com/prometheus/alertmanager/releases/download/v0.25.0/alertmanager-0.25.0.darwin-amd64.tar.gz' -L
  tar -zxvf alertmanager-0.25.0.darwin-amd64.tar.gz
Get into the unzipped folder and give "alertmanager.yml" a makeover. We're talking
email_configs– set up the sender's credentials to get those emails flowing. Here's what the code config for "alertmanager.yml" looks like:route: group_by: ["alertname"] group_wait: 30s group_interval: 1m repeat_interval: 2m receiver: "send_email" receivers: - name: "send_email" email_configs: - to: <RECEIVER_EMAIL> from: <SENDER_EMAIL> smarthost: smtp.hostinger.com:465 auth_username: <SENDER_EMAIL> auth_password: <PASSWORD> require_tls: false inhibit_rules: - source_match: severity: "critical" target_match: severity: "warning" equal: ["alertname", "dev", "instance"]💡Remember, you'll need to replace<PASSWORD>,<SENDER_EMAIL>, and<RECEIVER_EMAIL>with actual values that you're using for your setup. Also, ensure that you have the correct SMTP server and port details for your email service provider (like Hostinger) in thesmarthostconfiguration.With our Alertmanager all set up, it's time to kick off our Alertmanager instance.
./alertmanager --config.file=alertmanager.ymlNext on the checklist: we've got to give Prometheus the lowdown on this alert file, so whenever it goes off, it shoots alerts straight to Alertmanager. Just a tiny tweak is needed under the
alertingconfiguration'stargets.Here's what the updated "prometheus.yml" configuration looks like:
  # my global config
  global:
    scrape_interval: 5s # Set the scrape interval to every 5 seconds. Default is every 1 minute.
    evaluation_interval: 5s # Evaluate rules every 5 seconds. The default is every 1 minute.
    # scrape_timeout is set to the global default (10s).

  # Alertmanager configuration
  alerting:
    alertmanagers:
      - static_configs:
          - targets:
             - localhost:9093

  # Load rules once and periodically evaluate them according to the global 'evaluation_interval'.
  rule_files:
      - "prometheus.rules.yml"
      - "alerting.rules.yml"

  # A scrape configuration containing exactly one endpoint to scrape:
  # Here it's Prometheus itself.
  scrape_configs:
    # The job name is added as a label `job=<job_name>` to any timeseries scraped from this config.
    - job_name: "node_exporter"

      # metrics_path defaults to '/metrics'
      # scheme defaults to 'http'.

      static_configs:
        - targets: ["localhost:9100", "localhost:9101"]
          labels:
            group: "production"
        - targets: ["localhost:9102"]
          labels:
            group: "development"
Time to take a peek at the Alertmanager dashboard – head over to localhost:9093/#/alerts. If Prometheus has been busy firing alerts to Alertmanager, you'll see something like this:

If that screen shows up as smooth as a whistle, keep an eye on your inbox too. I got one of these emails myself, and it looks a little something like this:

Voilà! You have done it. 🥳
Big high-fives to you for nailing the whole end-to-end monitoring and alerting setup with Prometheus! You've levelled up your tech game, my friend. Time to keep those systems in check and those alerts in the loop. Great job! 🚀🎉

Don't hesitate to drop me a line at himikas.work@gmail.com if you have any questions or want to chat further. Looking forward to catching you in the next article. Cheers and take care! 🚀🚀🎊